Agriculture
Crop health, plant count, weed density, plant stress, vegetation fraction, NDVI and much more is now possible in near real time.
Drones save growers Thousands
Having accurate, timely data allows growers to reduce inputs whilst also increasing yields.
Utilising the combination of drones, sensors and software it is now possible to gather comprehensive data on crops health, identify problem areas that require rectification. All done in a fraction of the time of other methods.


SlantView’s Plant Population layer provides a true stand count. Unlike other techniques which simply estimate populations by searching for gaps in crop rows, SlantView’s algorithms actually detect each plant in the field and segregate them into crop or weed populations for accurate counts. Populations are indicated in plants per acre as shown in the nearby example.
This information layer is designed for use in specific row crops under pre-defined conditions of measurement.

The Weed Density layer provides indicators to invasive plant species within early-stage row crops to support more targeted and efficient herbicide treatment. Weed density is indicated by the fraction of local area under weed coverage.
This information layer is designed for use in specific row crops under pre-defined conditions of measurement.
The Plant Stress layer combines multiple spectral bands across the visible and near infrared to measure pigment absorptance and cellular integrity that are markers for nutrient deficiencies, pest infestations, or dehydration conditions.
This information layer enables more efficient and accurate scouting by providing earlier and more comprehensive detection of stress conditions than possible with simple 2-band indices like NDVI. Contact us to discuss custom tuning for specific crops or conditions.

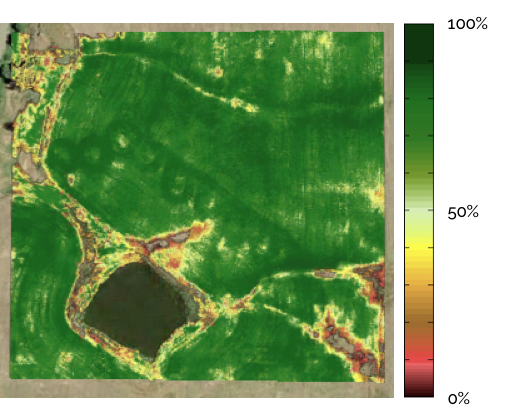
The Vegetation Fraction layer indicates the percentage of the field that is covered with the growing crop (also frequently referred to as “canopy closure”). Through the early weeks of the season this value will increase from zero until the fully developed canopy closes.
This information layer is valuable for locating mis-planted or thin coverage areas, or for measuring damage from weather or other events.
Multiple crop metrics are combined to assess future performance in the Yield Potential layer. This is the producer’s highest level assessment tool and includes the contributions of numerous independent factors that ultimately contribute to yield.

SlantView also produces traditional vegetation indices including:
Red NDVI (RNDVI)
Green NDVI (GNDVI)
Red Edge NDVI (RENDVI)

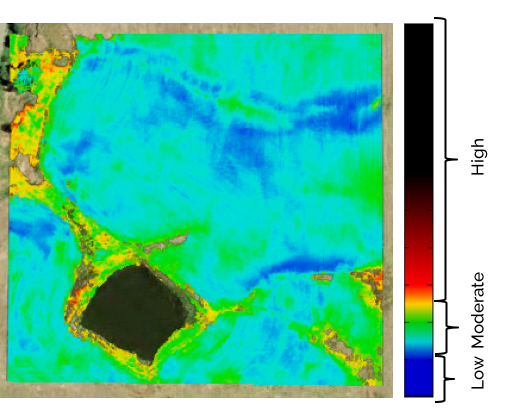
The Red-NDVI layer shows varying levels of health condition, most of which are known to the farmer as resulting from varying soil types and drainage patterns. NDVI however can’t reveal the farmer’s real concern..

The farmer’s real concern was a leaking irrigation system. After running SlantView’s Smart Detection algorithms, nutrient deficient areas exhibiting higher than normal soil moisture content were quickly identified (shown in image at left or above in red/yellow/white indicators). Conducting a similar survey traditionally takes 2 days for a scout on foot. SLANTRANGE results are available on-site within an hour.
Making crop decisions easier for growers
New technology, new company, new service, better information for Growers to make informed decisions about their crops